Introduction
In today’s blog post we will discuss how can you filter and enrich incoming data in Elastic Stack. We will use three examples, namely Logstash, MQTT Beat and custom application, which is used in our organization. This is a next post in the series about Elastic Stack possibilities and its usage in Grandmetric.
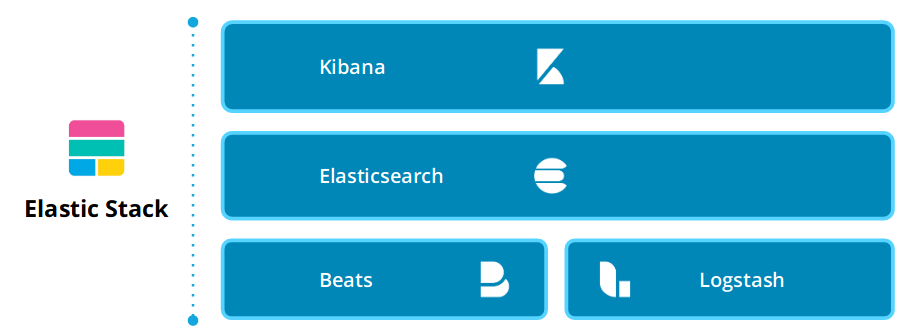
Elastic Stack [1] allows using multiple data sources. On the ingest-layer you can use Logstash, any of the Beats, or a custom application, which feeds Elasticsearch with the data through the API. Each of them can be customized or configured to some extent. In this blog post, we will present how Elastic Stack can be configured to provide data in the format we want.

Figure 1: Elastic Stack layers [source: Elasticsearch Best Practice Architecture]
Logstash
Let’s take Logstash as the first example. Our use case is the following: a network device is sending its logs to the rsyslog server. It creates around 1000 logs per minute with different severity. Due to formal obligations we are required to store all logs for 5 years, but in the same time we would like to create alerts and visualizations based on error and critical logs. Due to this we couldn’t disable any of the severity on the network device. All logs (debug, info, warning, error, and critical) are forwarded to the rsyslog, where syslog rotate is defined to compress logs and store them. Then they are forwarded to Logstash. On the Logstash side, we’ve defined a filter, with the following configuration:
input {
 tcp {
  port => 5000
  codec => "json"
  type => "rsyslog"
 }
}
filter {
 if [severity] == "info" {
  drop { }
 }
 if [severity] == "debug" {
  drop { }
 }
}

output {
 elasticsearch {
  ...
 }
}
This Logstash pipeline configuration drops all messages, where severity is either info or debug. Such approach allows to fulfill our requirements – we can easily keep long history with detailed logs – while they can be kept away from Elasticsearch cluster, and they don’t have negative impact on performance or require high storage. On the other hand, warnings, errors and criticals are forwarded to the Elasticsearch, where we can define alerts and visualize them in Kibana, or easily filter and search.
Beats
Now, we can take a look on one of the Beats, namely MQTT Beat [2]. We use it to monitor specific topics on MQTT broker, where Wi-Fi monitoring info is sent. There are almost 500 devices in a building split onto different floors and deployed in different rooms. (If you are interested in more details about Wi-Fi monitoring, please follow our other blog post.) Each of the devices has its own MQTT topic. Since the topic itself carries information about location, it is not duplicated in the message payload. MQTT Beat does not split the topic in any way, but keeps the whole topic-path in a single field. We’ve created an ingest-pipeline, which has two processors to handle this issue.
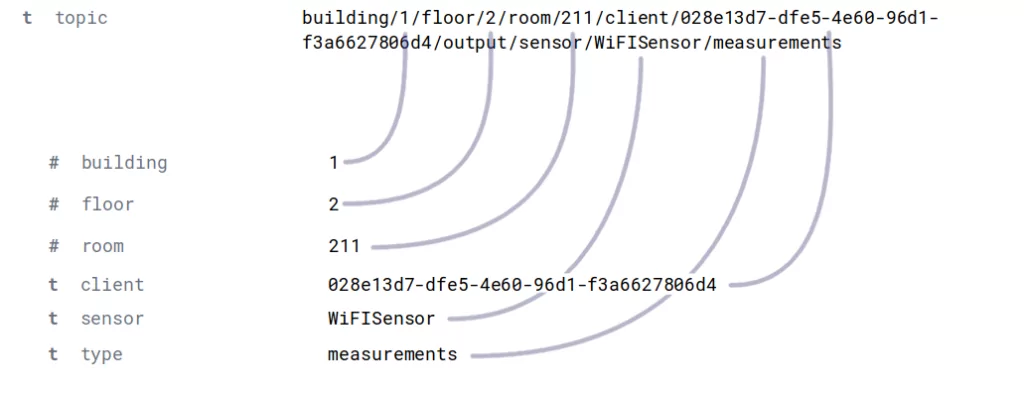
From a field called “topic”, we extract the following fields: building, floor, room and UUID. Moreover, the topic field is not meaningful for us anymore, so the second processor removes this field:
"dissect-topic" : {
  "description" : "Pipeline used for dissecting topic",
  "processors" : [
    {
      "dissect" : {
        "field" : "topic",
        "pattern" : "building/%{building}/floor/%{floor}/room/%{room}/client/%{uuid}"
      }
    },
    {
      "remove" : {
        "field" : "topic"
      }
    }
  ]
}
When the data is indexed in Elasticsearch it already has desired fields. The following figure shows how the topic field was dissected into separate fields.

Figure 2: Topic dissecting example
Custom application
In one of the previous posts we described, how we connected software for ticket tracking with Elastic Stack. The tool we are using allows adding tags to the tickets based on an e-mail it came from or keywords in the e-mail topic. We use that to organize tickets in this tool, but when we transfer the data to Elasticsearch and visualize it in the Kibana, we would like to create “pretty” reports. This is why we rename some fields using the following processor:
"parse_desk" : {
 "description" : "Pipeline used for parsing data from desk",
 "processors" : [
  {
   "foreach" : {
    "field" : "tags",
    "processor" : {
    "set" : {
     "field" : "customer",
     "value" : "Pretty name of the customer",
     "if" : "_ingest._value.name == 'sd_cust1_tag'",
     "ignore_failure" : true
     }
    }
   }
  }
 ]
}
Thanks to such processor we achieve the following benefits:
- instead of a tag, which has some limitations (e.g., cannot include spaces), we can present the customer name in a “pretty” form;
- from one field (called tag), which can include different types of tags, we can extract different custom fields. In the above example, we extract only a customer name, but in the same manner, reported problem type can be extracted into a separate field.
Summary
In this blog post we showed three examples of input data customization on different levels and different applications. We are not limited to what the tool offers, but we can easily create processors and filters, which preprocess the data before indexing it in Elasticsearch. Thanks to this, we can lower amount of data stored in the database and improve performance of the cluster. Moreover, such approach enriches the data and allows to modify it to the required format.
If you are about to design your solution architecture based on Elastic Stack, you are considering some upgrade, or you are stuck with some issue, we are happy to help you – feel free to drop a comment below or reach us via email.
References
[1] Elastic Stack, https://www.elastic.co
[2] https://github.com/nathan-K-/mqttbeat


Leave a Reply