I want to thank all readers for their interest in the post and the discussions we had during the past months about 5G health issues. There was a high number of supporting comments and requests for clarification, but also quite a few critical comments to both of my published posts (What’s wrong with the “studies” and 5G health issues explained).
We thought it would be worthwhile to summarize a few interesting discussion topics in a new post since future readers will probably not try to dig through the whole discussion thread. To keep this amendment at a manageable length, I have taken the freedom to shorten, group, and summarize the topics, rather than repeat everything.
Frequency and Transmitted Power in Mobile Networks
My first group deals with radiated power, frequencies, and exposure times. Let me quote a few of the statements:
These frequencies have never been used in consumer applications!
Comparing any radio transmitter to 60 W light bulb proves that the writer may lack knowledge about light and radio waves …
Most of the 50 W lightbulb will go to heat and not light.
What is the need for so many dipoles in one antenna?
Plus, on a video blog, someone used the figures I provided as a basis to dream up a real horror scenario (as he puts it). I will deal with this further below.
Mobile frequencies
It seems to me that I have to repeat a few key facts: Concerning the interaction of electromagnetic radiation with matter, in particular with living tissues, there are only two relevant parameters: frequency and power.
All electromagnetic radiation is a stream of massless particles, the photons that carry the energy. The total energy is the sum of the energies of the transmitted photons. It requires a single photon to have enough energy to break or alter a chemical bond, which is what biologists require to see free radicals and other unpleasant chemistry in our bodies. If the photon’s energy is not high enough, all that ever happens is that the whole molecule is agitated – an effect that we call heating in daily life.
These are the thermal effects that are controlled by limits on transmitted power. You feel that as heat on your skin in sunlight. Where sunlight comes with several 100 Watts of power per square meter. The tower radiation is limited to 20 Watts per antenna, and a total limit per location, and I have shown you the Milliwatt and Microwatt levels that finally reach people on the street. Plus the photons of microwave radiation are about 10,000 times weaker than those of visible light. It needs UV light, X-Ray, and worse to create the claimed medical effects.
The bulb example
Coming to the light bulb example, which created a heated discussion. Basically, with a conventional light bulb, all-electric power fed to the wire is turned into electromagnetic radiation. Most of it is actually infrared (heat), and only a little bit – like 5% – is visible light. Still, both heat and light have more powerful photons than microwaves. So, in fact, a lightbulb is a much more dangerous object than a mobile phone (20 – 60 Watts of IR and light vs. 200 Milliwatt of microwave).
The topic of “lack of experience” with what is called “5G frequencies” is next. The 5G standards define a lot of frequency bands. Not all of the defined frequency bands will be used – at least not in near-time. Manufacturers and phone makers will not be able to design and produce radio equipment for all frequency bands. As reported by the industry association GSA, at present, out of 1560 licensed bands worldwide (FDD mode), the most popular ones are:
These frequency ranges cover 85% of the total licensed spectrum worldwide. In terms of the size of radio networks (and thus the number of base stations and antennas), the most popular is band 78, with 3,500 MHz, previously allocated to a technology called WiMax, with a considerable deployment worldwide. T-Mobile US is even rolling out a 600 MHz 5G network. It must be quite disappointing to fear-mongers and conspiracy believers to see that these are all well established and previously used frequencies. Billions of WiFi-Routers worldwide use the 5 GHz ISM band, and they do it for more than 10 years.
The much-discussed higher frequency bands beyond 20 GHz are not widely used today, except in the US for some congested inner-city areas. But they have already been used for LMDS (n257) and satellite TV communication (bands n258 – n261) before. There is nothing really new here, too. TV and other communication satellites transmit at 200 – 300 Watt power level. The signals are transmitted through large parabolic dishes and arrive on the earth surface from 35,000 km above at a level of -100 dBm to -110 dBm. That is still within the range of normal cell phone tower radiation. We do have long term experience with this radiation.
A general “common sense” argument may be in order here: all current radio technologies use very similar radio chipset designs. There is no magic design secret. And all commercial operators of radio technology want to use as little electrical energy as possible. That’s because the electricity bill is high up on their monthly bill. Nobody is going to use extra power if it is not strictly required. If a mobile phone can detect and decode signals received at -80 dBm or less, then the transmission power is adjusted so that the phone receives it.
The “antenna gain” issue I have already discussed in an amendment to the first post. Thus I think it will be enough to repeat a few key points:
Antennas are not active amplifiers. They do not add power to the signal.
Directional antennas (such as mobile communication) focus the waves in the main direction, perpendicular to the antenna surface. They work a bit like a camera lens. In all other directions, the signal is reduced. The so-called antenna gain (which should rather be called directional gain) is the main direction’s amplification factor. When you move sideways, the signal starts to drop. At 30 degrees, it is only half, and at 60 degrees, it is practically zero.
Typical mobile phone antennas have got a directional gain of 16 dB. Off-the-shelf satellite dishes have got a higher gain of 25 dB. But their covered sector is only a few degrees wide, which makes them unusable for mobile networks. (Have you ever tried to adjust a satellite dish to receive the signal from “your” satellite?) A high antenna gain for a mobile network would require the transmitted beam to swipe the area, like a lighthouse signal. Something like that is being introduced with the Massive MIMO technology.
When considering environmental and health impact, the antenna gain does not play a role, since we need to look at average values around the tower.
And even when someone sits straight in front of the antenna, they will only get less than 1 Milliwatt of radiation power. That’s more than 200 times less than the handheld phone’s signal strength or from your home WiFi access point.
How many dipoles in one antenna?
Finally, let us deal with the related question concerning the number of dipoles in one antenna.
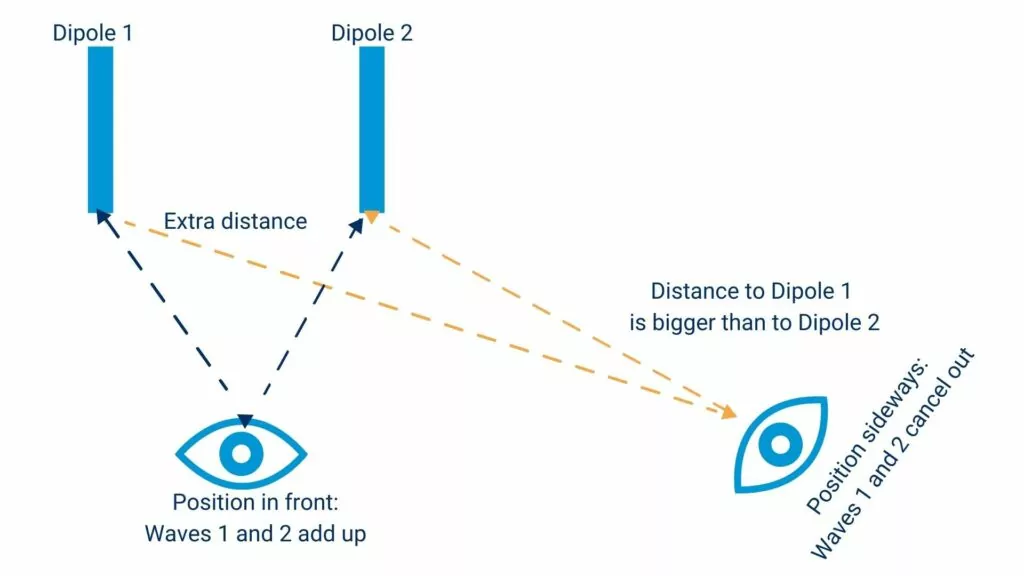
An array of dipoles generates a directional effect. The dipoles transmit the input signal to the antenna in full sync. If you stand perpendicular to the antenna plane, you get all the signals from the dipoles in synch, and the waves are simply adding up. When you look at the antenna from an angle, the distance between you (your phone) and each dipole varies a little. That makes a small shift of the waves from one dipole relative to each other (see figure below).
Received Power in a Mobile Network (Propagation and Path Loss)
I’ll take your word about the 4th power, though I was taught the “inverse square law,” i.e., second power.
Can you show us how to derive your formula for path loss? It is noted that the Hata model is not suitable for micro-cell planning where the antenna is below roof height, and its maximum carrier frequency is 1500MHz. It is also not valid for 1800 MHz and 1900 MHz systems.
Why is the frequency not visible in the formula? How would the formula look for higher frequencies?
Are we talking about power or power per square meter (power density) here?
The 4th power
Let me start here with a general disclaimer. The distance-dependent formula for the path-loss I used in my post is from a specific model they use at Ericsson [Ericsson9999] for 1 GHz of frequency. There are many alternative models out there, and when people from within the business talk about the Okumura-Hata model, they no longer refer to the original data and model. Things have been developed a lot over the past 50 years, as you can assume, and there are models available for each and every frequency that may be in use in the future.
I really don’t want to sit down here and explain the parameters (I think you believe me that I could). Let me get two fundamental facts out:
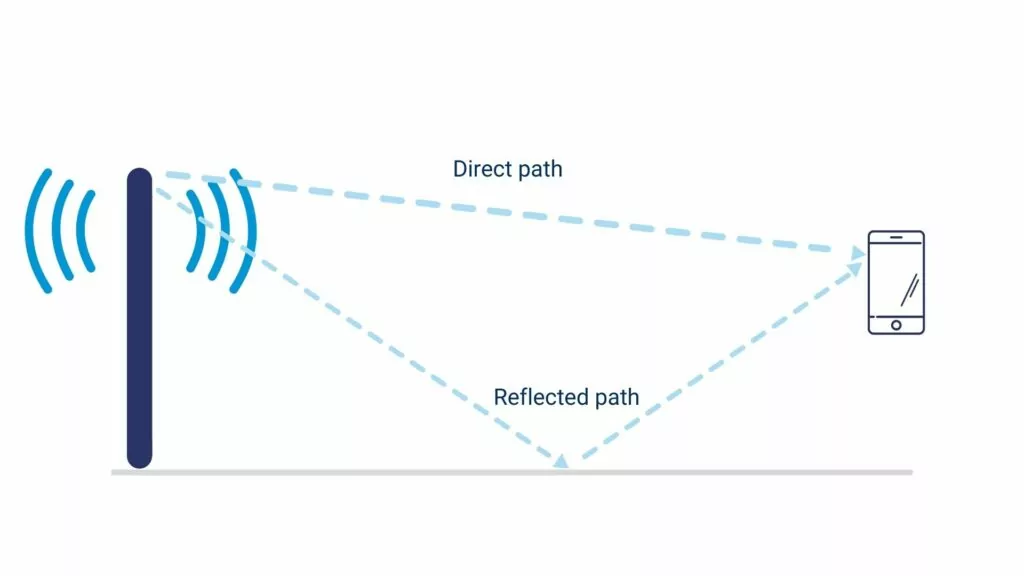
The “4th power” dependency on distance comes already in when you look at the simplest possible real-world model: following two rays from the same antenna to a receiver; one direct and the other reflected on the ground or a wall. The reflected wave travels a little longer distance so that they are delayed at the receiver. When you work out the sine/cosine algebra, 4th power is exactly what you get.
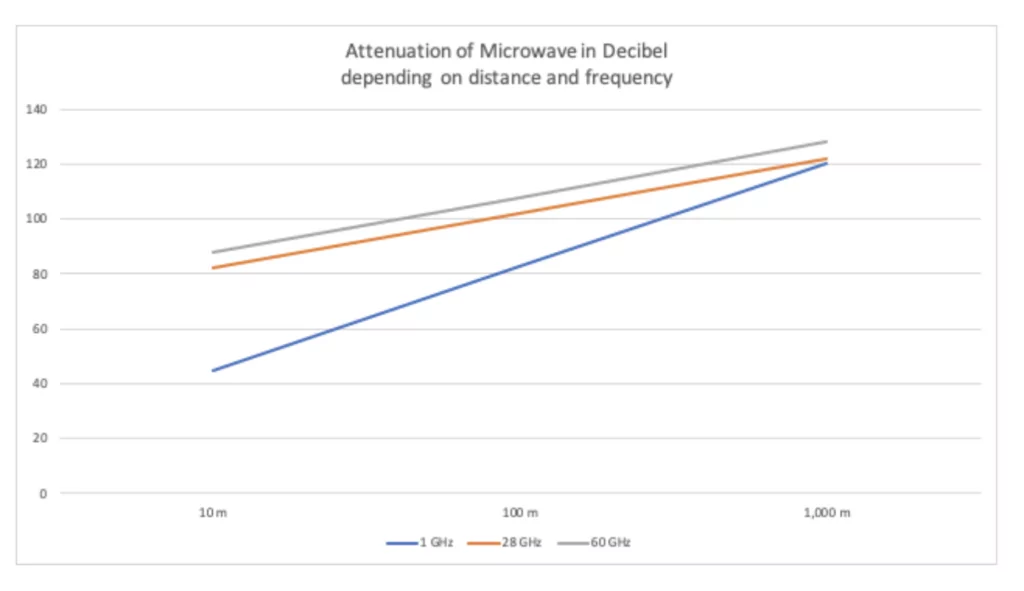
In the high-frequency band above 20 GHz, there is basically no reflection on the ground or at walls – surfaces would need to be smooth down to fractions of an mm to reflect enough radiation for the calculation above. In fact, we are left with inverse square power for these frequencies. The diagram below shows a comparison between 1 GHz and the high-frequency range (28 and 60 GHz under inverse square law) between 10 m and 10 km from the source.
This picture’s significance is: at a distance of 10 m from the antenna, with 28 GHz, you need to transmit 37 dB more power (which is about 5,000 times higher) compared to 1 GHz. In a distance of 100 m, the ratio is still 80. For distances above 1 km, this picture does not tell you anything, since the high-frequency model’s validity is limited to short range.
Attenuation models
The main attenuation models are:
Irregular Terrain Model (ITM, “Longley-Rice”) used by FCC and applicable from 20 MHz to frequencies above 20 GHz
COST231-Hata European extension to Hata model valid up to 2 GHz
ITU-R P.529 (700 MHz to 3.5 GHz) – covers all of 4G and most of 5G frequencies
Ericsson 9999 (150 MHz – 3.5 GHz)
SUI, Stanford Interim Model (1.9 GHz – 11 GHz, originally developed for WiMax communication)
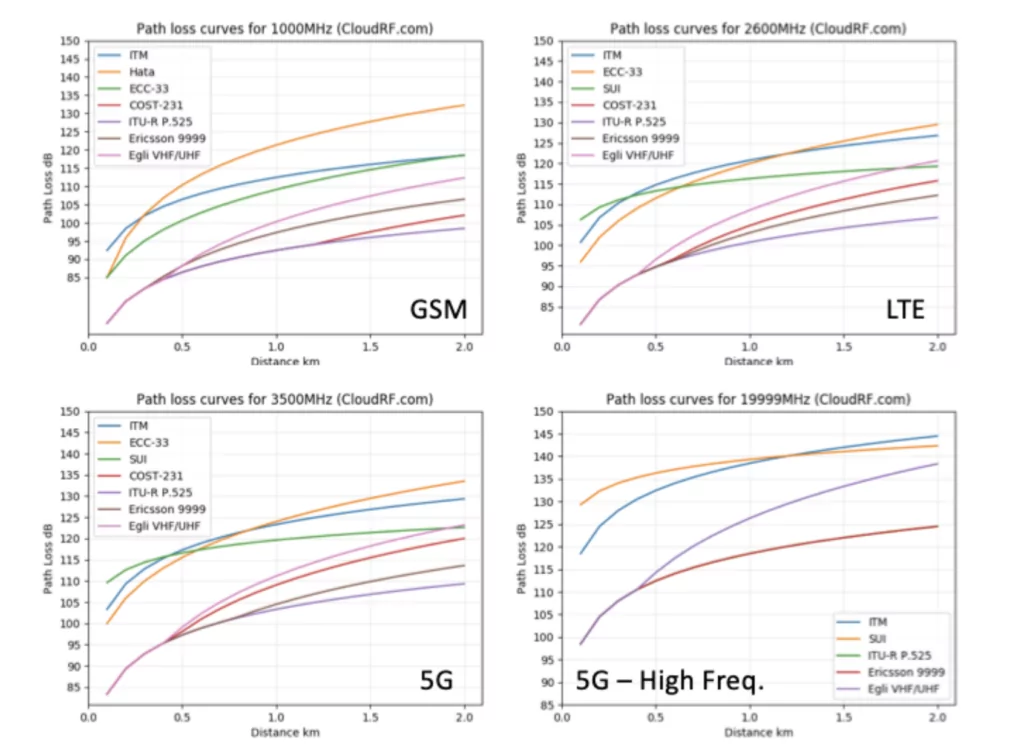
You see: the situation is quite complex. These models have made certain assumptions about the ground, heights, etc. and adjustment data. Rather than developing the theory here, I would like to give you an impression of some of these models and how they work, depending on frequency and distance. The charts are taken from the website CloudRF.com, where you can find a lot more if needed. Two observations may be in order:
Where applicable, the Ericsson9999 model that I have used gives a rather low attenuation (which means stronger fields). When you compare LTE frequencies and the two 5G frequency charts, you see hardly a difference overall.
Final remark: This is all for outdoor, including my first formula in the blogpost. Modern humans spend most of their day indoors; on average, you will have to add 15 Decibel of attenuation to receive an indoor figure. That’s a field energy drop to a value of 1/30 of the corresponding outdoor value. My advice for using these pictures: do not try to read any explicit and detailed value from these charts and try to apply it in a real situation. You need to understand the side-conditions and correction factors.
People asked to compare the mobile network values with satellite radiation. Communication satellites and TV satellites transmit in the frequency range between 6 GHz and 20 GHz (there are higher frequencies, too). This reserved range is why 5G needs to go up to 28 GHz for high band transmission. Very roughly, the satellite data are:
200 – 300 Watt of power (which is 53 dBm – 55 dBm)
Transmission antenna gain of 25 – 40 dB (large parabolic dishes)
Path loss (from 35,000 km) about 200 dB. Note that medium (MEO) or low (LEO) earth orbiting systems like GPS have got a much lower path loss (150 dB to 170 dB).
Which gives you about -120 dBm of received power for geostationary orbits, and -80ish for MEO and LEO orbits. Which is well within the ballpark of mobile network field power.
Last question to be discussed in this section: Power density is usually stated in (Watt/square meter); my figures were confusing a few readers. But putting antenna gain in produces “real” power values. And when it comes to estimating effects on the human body, the effective aperture of a human is way lower than 1 m2. Summing this up, the radiation received by a human from mobile towers during the day is about 1% of the already low microwatts that the Hata-model delivers.
Impact on Humans
Several topics have been brought up in the comments that I did not address in the original blog. I cannot discuss them all here, so I picked a few and summed them up. The topics:
5G is causing Corona or at least strongly related to the spread of the disease
The real long-term effects are a non-stop chronic radiation of 1 V/m everywhere from mobile towers.
A long list of respected scientists issue warnings and call for a moratorium and further in-depth studies of medical risks associated with 5G.
You are not an expert, and you are referencing to a small group of controversial ICNIRP/WHO experts.
The CoVid-19 topic was obviously brought up after I wrote the original post. The allegations are widespread:
CoVid-19 is not a real virus; it is used as a cover-up of 5G damages (which, according to some conspiracies, are planned measures).
5G was tried in Wuhan (Hubei) and its damaging biological effects weakened or changed the immune system of some animals to let the virus mutate.
I am not an expert in this area, and I never claimed to be one. As a professional scientist, I know how to tell bad science from good science. My understanding is that all leading virologists worldwide have a unanimous stand on this: The SARS-CoV-2 virus is a member of the well-known virus family of Coronaviridae (Nidovirales). It has its natural reservoir in bats. It has one of the largest genomes of any known virus, making it completely unreasonable to speculate about a lab creation. Closely related viruses like SARS-CoV-1 and MERS-CoV have made the transition to humans before – and without the presence of 5G and actually without any widespread mobile technology in the areas where this happened.
One of the comments brought up the famous memorandum and asked for my opinion. I really don’t want to go again into all the things mentioned there; much of it has been discussed in part 2. I know most signatories; these have been mostly the same names for more than 20 years. And it is not what it tries to make appear: this is not the memorandum of “science”; there is a colorful list of activists, journalists, family doctors, etc. Nobody of “weight” in the scientific community.
The book of Arthur Firstenberg, “Microwaving the Planet,” was mentioned and recommended in a comment. This book is a conspiracy theory at its best if you ask me. And if you look at Firstenberg’s vita, you will find that he dropped out of medical school due to illness, which he then attributed to electromagnetic hypersensitivity brought by numerous x-rays. This story looks very familiar and is a typical source of EMF claims: some people tend to project their problems on external causes. You’ve got a headache; it must be the cell tower nearby.
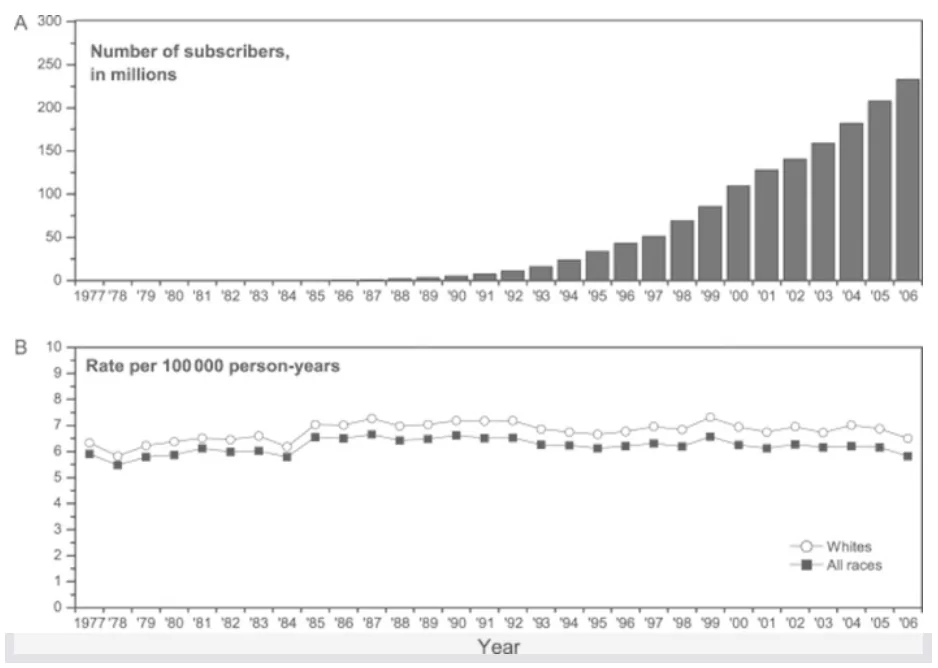
For the claimed long-term effects of mobile network radiation, please check the following chart. It shows by example that the claimed medical consequences of mobile phone radiation really do not exist. This chart compares the brain cancer incidents and mobile phones’ growth in the US from 1977 to 2006. Brain cancer is the most frequently claimed disease in connection with mobile communication. Comparable charts exist for basically every claimed damage that mobile has been accused of causing in humans. There is not a tiny hint at correlation, let alone causation.
((A) NUMBER OF WIRELESS SUBSCRIBERS IN THE UNITED STATES, 1984–2006. (B) AGE-ADJUSTED INCIDENCE OF BRAIN CANCER IN THE UNITED STATES (2000 POPULATION STANDARD), SEER 9, 1984–2006. SOURCE: WWW.NCBI.NLM.NIH.GOV/PMC/ARTICLES/PMC3098028/)
Concerning the expertise issue brought up in the comments: I rely on published, peer-reviewed medical research when it comes to medical effects. And I’m afraid I have to disagree with the claim that I only refer to a “small controversial group of WHO experts.” The WHO is certainly not a small group of conspiring scientists. The European Union’s Scientific Committee on Emerging and Newly Identified Health Risks (SCEHINR) had reached the same conclusion. Please see their obvious final verdict.
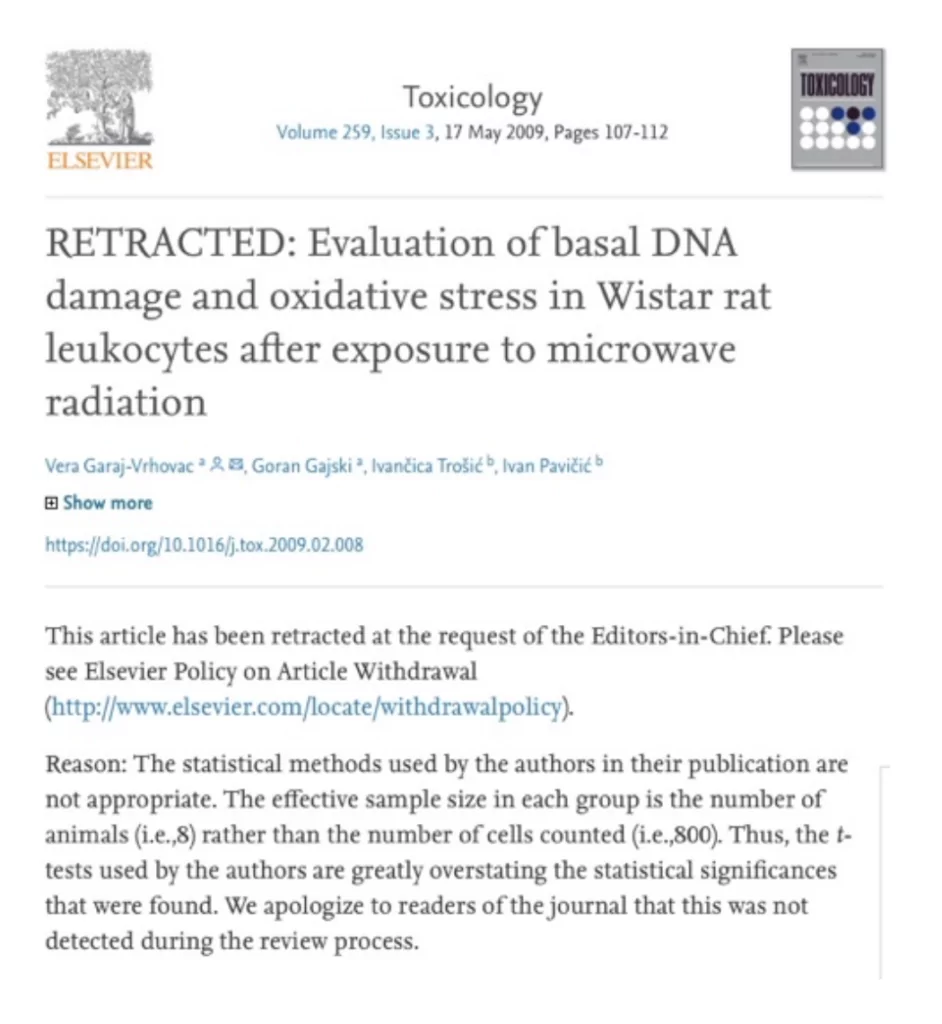
The overwhelming majority (and I am talking 99% here) of medical experts do not see the slightest problem. There is just this tiny, noisy group. I am still waiting to see a single study out of that circle that has made it through a leading scientific medical journal’s expert review cycle. Show me one, and we are in serious discussions. Those who say that this is part of the suppression mechanism applied by some corrupted “science elite”: the vast majority of such papers are already rejected for stupid simple quality reasons. See the snapshot from Elsevier’s journal Toxicology, with the rejection of a study claiming DNA damage based on microwave exposition.
Kurt Behnke received his PhD in Mathematics from University of Hamburg (Germany) in 1981, and his second degree (Habilitation) in 1986. He published more than 20 original research papers, joined the Max Planck Institute of Mathematics in Bonn as a guest researcher, was a Visiting Fellow at Warwick University, and was awarded a Heisenberg Research Grant from German Research Council in 1987. In 1991 he made a career shift to telecommunications, where he worked for Philips Communications on OSI system management applications for fiber transmission systems (SDH). In 1993 he joined the California based startup Raynet, and helped creating the first optical fiber access system. From 1997 on he worked for Ericsson in various national and international assignments. These included a position as Director of Customer Operations for T-Mobile International, and one as Head of Managed Services North Africa and Middle East. He went on old age retirement in 2017, where he keeps himself busy by starting to lecture part time on data communications and mobile networks at a local university, and he has occasional assignments for consultancy in the areas of LTE, 5G and machine-type-communications.
Issue is mobile phone mast is on constantly. Low-level non-ionising radiation thus present. I understand your prior comment that this low-level non-ionising radiation is not powerful enough to damge human tissue/DNA.
However what of the non-thermal effects? Or pyschological effects?
Look at history. Asbestos, Smoking, Diesel, Pesticides, Lead Alcohol, DDT, etc etc.
How many times has Government and Science made terrible mistakes? One must evaluate human history and take a prudent approach.
What if science one day finds non-thermal effects? In the last ten years the science is only going in one direction, that is, there may be effects. Look at the IARC change in classification in 2011. The NPT study in 2018 and Italian study in 2019. There is more disturbing literature in very recent years.
And look at the real world. Why if mobile phone base stations were so safe are countries such as France, India, Sweden, Israel, Italy etc etc doing different policies? All are being increasingly strict and ensuring no Wi-Fi in schools and no mobile masts near schools plus other restrictions. They are increasingly setting stricter guidelines too on emissions levels as the prior ones have now been deemed as too weak.
The UK government also allows schools and hospitals to double-check local mobile phone mast compliance? Why? If the science was so clear that there was no risk then why this need?
Another disturbing fact is this. Why are major insurance companies deciding not to insure against EMF risk? Why are shareholders being warned of potential major financial losses should EMF risks come to light? If there was zero risk then there would be no reason for these warnings.
I spent the last month going over various articles and studies and the more I read the more holes I find. The science is not a shut and done case – more research is being carried out, more is needed and more evaluation will be done.
Just to let you know I did not purchase a house due to a mobile phone mast being present in the near viccinity of the property. 15m high mast. Perhaps one day to be converted to a 25m mast with more powerful antennas under the 5G era.
How do we know the mast has been properly installed, implemented and maintained? How do we know it is not therefore outputting more than allowed under legal rules. If a shared mast (which this was) what of the combined emissions? And the interaction with other emissions such as Wi-Fi, Bluetooth, Mobile phone etc etc on a daily basis?
If the maintainer of said mast had nothing to hide why can they not provide a proof of what the mast technically can output at max, whether it can malfunction and output more and when the last compliance check was done?
More transparency would help the general public who are concerned. I am sorry for the all the questions but it is what it is. There are never straight easy answers in life and this is another case of that.
I very much am grateful for your comments as you gave me a key bit of information. It seems from your argument that Wi-Fi devices and Routers in home are outputting more emissions than a nearby mobile phone base station (let us say 250m away). However, (one last question) did this take into account a 25m (or higher) mobile phone base station outputting at 200W?
I look forward to your reply.
Thank you for your time, patience and understanding.
I am not taking this as a challenge. Just try to respond to your points. Will trash all following comments since we are turning in circles here.
“Mast (antenna, to be precise) is on constantly”. So what? The accumulated received power by anyone’s body is still orders of magnitude lower than the one received from your mobile phone in your hand or pocket. Just one final argument to this, since I have covered this in length: The best reception level (RSRP) you can get is about -50 dBm. Show me any higher – but not measured by any of the cheap EMF meters you can buy at esoteric shops; have someone with a serious device (>10k$) sit and measure. Now -50 dBm, that is 10^{-5} MILLIWATT. And that applies only when you are in direct neighborhood of the antenna and outdoors. If you are away, in resonable distance, you get something like -80, and indoors you get another -10 to -20 less. A mobile phone transmits at max 200 Milliwatt; typically much less, though due to power control. But your home WiFi transmits constant 100 mW, and each device does the same. Total received power at 100 mW during one hour of phone operation during a day: 0,1 Watt-hours. Total received power from the cell tower during 24 hours of permanent transmission at -50 dBm (which is never true!!) 0,0024 Watt-hours. That’s 50 times less.
“What about non-thermal effects?” and “what if science one day finds non-thermal effects?” I just answer: there are none. That’s not subject to medical studies, that is hard physics. If my action cannot shake a single electron, there is no effect. No discussion. Full Stop here.
There is a library of scientific work on electromagnetic radiation, collected at the University of Aachen, Germany (www.emf-portal.de). It lists over 30,000 study items. That makes electromagnetic radiation effects on the body and other living tissues the best studied subject worldwide and of all times. Orders of magnitude higher than for example any study on chemicals. The laws of electromagnetism stand for more than 1 1/2 centuries now; and each young physicist dreams about finding a small gap in there once – to become ultimately famous, on the level of Maxwell, Einstein or Planck.
When you refer to “in the last 10 years the science is only going in one direction, that is there may be effects” then I don’t know what “science” you are referring to. I bet it is this growing pseudoscience, never published except on youtube and the internet. Non replicable results, that no one could ever confirm, in many cases even proof of fraud.
When you refer to IARC, then you should read the report, and not follow sensational headlines. Their summary is “To date, no adverse health effects have been established as being caused by mobile phone use”. The 2B classification is there for a single reason: all studies are time-limited – you would need to follow a large group over their whole lifespan to get absolute certainty (and even then one could raise concerns over the ‘limited number of participants’). ‘Red Meat’ is classified higher, in 2A, as a comparison.
The political sphere is of course a mine-field. Politics is driven by public opinion (among other influences). And the pros and cons in each country result in different political compromises. The insurance argument is quite interesting. I have talked to someone I know personally, who is in the risk department of a large insurer. His reply was quite short and crisp: “We simply do not want to fight all the fights with these conspiracy people. We know for sure, that once such a product would be out on the market we would have a certain uptake, and only days later, we would have had a wave of unjustified claims – each of these go to high courts since these people are just crazy. This is a no-brainer for insurance companies.”
Due to the public controversies there are strict regulations in every single country i know (and I have been in many countries as part of my career). Each tower that is build needs an EMF conformity declaration. The national regulators have measurement task forces out there, to check. Not every tower, of course. Violation is usually penalized quite heavily. But be assured: no network planner would ever get up to the output power limits. Every person who claims that reveals that he or she has no clue about the working of a mobile network. Let me give you two or three sentences: Mobile communication is bothways: uplink and downlink. Uplink is transmitted by the phone. Which transmits up to 200 Milliwatt, as stated earlier. And this signal experiences the same path loss as the downlink radiation from the tower. And still needs to get through to the tower. What sense would it make, to power up as much as you can, and then not “hear” the mobiles. No communication would ever be established. Also high output power would cause interference in neighbor cells. In reality, in dense areas like inner cities, the output power of a cellular antenna is way less than the allowed.
The network operators are providing full transparency. The regulators have registers, in many countries even maps where you can locate the owner and operator of each antenna, and the max output power. You just have to go and inquire.
Your last question: 25 m tower, 200 Watt: Yes, that scenario is included in the calculation. Actually 15 m is quite unusual, in particular in urban environment. Most of the radiation of a 15 m or less tower would actually go against building walls and being absorbed there to the largest part (a 10 dB “penetration loss” at a building wall which is not uncommon, would mean 1/10 of the radiation go through, the rest be absorbed by the wall.)
One question, just to make sure I have understood you correctly..
You wrote:
„ when someone sits straight in front of the antenna, they will only get less than 1 Milliwatt of radiation power.“
When you look at the measurement setup and conditions you will notice that they have been using mMIMO antennas, in 8×8 and even 32×32 formats. Which gives you an “extra power” of about a factor of more than 100 at the peak point. But — no reason to worry: this is not a permanent impact. An mMIMO antenna will regularly sweep the sector, so that every device in the cell gets an equal share. When you look at the charts you see that the field strength decays quickly with angle. Also, looking at the real measurements (not the charts), you see figures like -50 to -87 on the vertical axis. That is the received power in dBm.


OK I am not still not convinced so let us debate;
Issue is mobile phone mast is on constantly. Low-level non-ionising radiation thus present. I understand your prior comment that this low-level non-ionising radiation is not powerful enough to damge human tissue/DNA.
However what of the non-thermal effects? Or pyschological effects?
Look at history. Asbestos, Smoking, Diesel, Pesticides, Lead Alcohol, DDT, etc etc.
How many times has Government and Science made terrible mistakes? One must evaluate human history and take a prudent approach.
What if science one day finds non-thermal effects? In the last ten years the science is only going in one direction, that is, there may be effects. Look at the IARC change in classification in 2011. The NPT study in 2018 and Italian study in 2019. There is more disturbing literature in very recent years.
And look at the real world. Why if mobile phone base stations were so safe are countries such as France, India, Sweden, Israel, Italy etc etc doing different policies? All are being increasingly strict and ensuring no Wi-Fi in schools and no mobile masts near schools plus other restrictions. They are increasingly setting stricter guidelines too on emissions levels as the prior ones have now been deemed as too weak.
The UK government also allows schools and hospitals to double-check local mobile phone mast compliance? Why? If the science was so clear that there was no risk then why this need?
Another disturbing fact is this. Why are major insurance companies deciding not to insure against EMF risk? Why are shareholders being warned of potential major financial losses should EMF risks come to light? If there was zero risk then there would be no reason for these warnings.
I spent the last month going over various articles and studies and the more I read the more holes I find. The science is not a shut and done case – more research is being carried out, more is needed and more evaluation will be done.
Just to let you know I did not purchase a house due to a mobile phone mast being present in the near viccinity of the property. 15m high mast. Perhaps one day to be converted to a 25m mast with more powerful antennas under the 5G era.
How do we know the mast has been properly installed, implemented and maintained? How do we know it is not therefore outputting more than allowed under legal rules. If a shared mast (which this was) what of the combined emissions? And the interaction with other emissions such as Wi-Fi, Bluetooth, Mobile phone etc etc on a daily basis?
If the maintainer of said mast had nothing to hide why can they not provide a proof of what the mast technically can output at max, whether it can malfunction and output more and when the last compliance check was done?
More transparency would help the general public who are concerned. I am sorry for the all the questions but it is what it is. There are never straight easy answers in life and this is another case of that.
I very much am grateful for your comments as you gave me a key bit of information. It seems from your argument that Wi-Fi devices and Routers in home are outputting more emissions than a nearby mobile phone base station (let us say 250m away). However, (one last question) did this take into account a 25m (or higher) mobile phone base station outputting at 200W?
I look forward to your reply.
Thank you for your time, patience and understanding.
I am not taking this as a challenge. Just try to respond to your points. Will trash all following comments since we are turning in circles here.
“Mast (antenna, to be precise) is on constantly”. So what? The accumulated received power by anyone’s body is still orders of magnitude lower than the one received from your mobile phone in your hand or pocket. Just one final argument to this, since I have covered this in length: The best reception level (RSRP) you can get is about -50 dBm. Show me any higher – but not measured by any of the cheap EMF meters you can buy at esoteric shops; have someone with a serious device (>10k$) sit and measure. Now -50 dBm, that is 10^{-5} MILLIWATT. And that applies only when you are in direct neighborhood of the antenna and outdoors. If you are away, in resonable distance, you get something like -80, and indoors you get another -10 to -20 less. A mobile phone transmits at max 200 Milliwatt; typically much less, though due to power control. But your home WiFi transmits constant 100 mW, and each device does the same. Total received power at 100 mW during one hour of phone operation during a day: 0,1 Watt-hours. Total received power from the cell tower during 24 hours of permanent transmission at -50 dBm (which is never true!!) 0,0024 Watt-hours. That’s 50 times less.
“What about non-thermal effects?” and “what if science one day finds non-thermal effects?” I just answer: there are none. That’s not subject to medical studies, that is hard physics. If my action cannot shake a single electron, there is no effect. No discussion. Full Stop here.
There is a library of scientific work on electromagnetic radiation, collected at the University of Aachen, Germany (www.emf-portal.de). It lists over 30,000 study items. That makes electromagnetic radiation effects on the body and other living tissues the best studied subject worldwide and of all times. Orders of magnitude higher than for example any study on chemicals. The laws of electromagnetism stand for more than 1 1/2 centuries now; and each young physicist dreams about finding a small gap in there once – to become ultimately famous, on the level of Maxwell, Einstein or Planck.
When you refer to “in the last 10 years the science is only going in one direction, that is there may be effects” then I don’t know what “science” you are referring to. I bet it is this growing pseudoscience, never published except on youtube and the internet. Non replicable results, that no one could ever confirm, in many cases even proof of fraud.
When you refer to IARC, then you should read the report, and not follow sensational headlines. Their summary is “To date, no adverse health effects have been established as being caused by mobile phone use”. The 2B classification is there for a single reason: all studies are time-limited – you would need to follow a large group over their whole lifespan to get absolute certainty (and even then one could raise concerns over the ‘limited number of participants’). ‘Red Meat’ is classified higher, in 2A, as a comparison.
The political sphere is of course a mine-field. Politics is driven by public opinion (among other influences). And the pros and cons in each country result in different political compromises. The insurance argument is quite interesting. I have talked to someone I know personally, who is in the risk department of a large insurer. His reply was quite short and crisp: “We simply do not want to fight all the fights with these conspiracy people. We know for sure, that once such a product would be out on the market we would have a certain uptake, and only days later, we would have had a wave of unjustified claims – each of these go to high courts since these people are just crazy. This is a no-brainer for insurance companies.”
Due to the public controversies there are strict regulations in every single country i know (and I have been in many countries as part of my career). Each tower that is build needs an EMF conformity declaration. The national regulators have measurement task forces out there, to check. Not every tower, of course. Violation is usually penalized quite heavily. But be assured: no network planner would ever get up to the output power limits. Every person who claims that reveals that he or she has no clue about the working of a mobile network. Let me give you two or three sentences: Mobile communication is bothways: uplink and downlink. Uplink is transmitted by the phone. Which transmits up to 200 Milliwatt, as stated earlier. And this signal experiences the same path loss as the downlink radiation from the tower. And still needs to get through to the tower. What sense would it make, to power up as much as you can, and then not “hear” the mobiles. No communication would ever be established. Also high output power would cause interference in neighbor cells. In reality, in dense areas like inner cities, the output power of a cellular antenna is way less than the allowed.
The network operators are providing full transparency. The regulators have registers, in many countries even maps where you can locate the owner and operator of each antenna, and the max output power. You just have to go and inquire.
Your last question: 25 m tower, 200 Watt: Yes, that scenario is included in the calculation. Actually 15 m is quite unusual, in particular in urban environment. Most of the radiation of a 15 m or less tower would actually go against building walls and being absorbed there to the largest part (a 10 dB “penetration loss” at a building wall which is not uncommon, would mean 1/10 of the radiation go through, the rest be absorbed by the wall.)