Handling tickets
Whether you provide some service or sell a product, you typically receive requests or reports (also known as tickets) about some issues. There are multiple platforms that help you with handling tickets. If you are starting your business, you might simply reply to those emails directly via your mail client, but it quickly becomes too hard to follow and handle all the issues. You might go with Zendesk, Teamwork Desk, Freshdesk or any other tool that suits you best. We chose the tool, from the same vendor, we were already using for different purpose for easy integration. It was great for following threads, tagging and grouping issues, taking notes and automating responses. In this tool we had access to basic statistics like ticket count or time graph with incoming tickets, but we were interested in more advanced stats, which could give us more insight into what is going on. That’s why we decided to integrate that tool with already used by us Elastic Stack [1].
Connecting dedicated ticketing system with Elastic Stack
Depending on your ticketing tool, the integration might be different. In our case, it was as simple as creating an incoming webhook, that forwarded the data to the specific index in Elasticsearch. Then in the ticketing app we could simply activate forwarding all incoming messages, updates of threads and all other taken actions to that webhook. This allowed us to keep the data in the Elastic Stack and visualise it using Kibana. In order to better organise the data we created an ingest-pipeline in Elastic – it allows to change the structure of incoming data before writing to the index. We used it for several purposes:
- dropping content of the ticket – we were not interested in keeping whole body of the emails, just keeping statistics about them;
- changing flat structure of tags – single ticket had several tags like: customer_A, problem_X, location_N. Instead of keeping an array of tags in elastic, we parsed it to keep in such form alongside with other data related to ticket: ticket.customer = A, ticket.problem = X, ticket.location = N
- renaming or dropping additional fields – some fields had not very friendly name, so it was more convenient just to rename it. Others, were completely redundant (like link to the avatar image of this customer).
Visualise the data
Once everything is in the Elastic, we can do whatever we want, and we are not limited by the summary provided by the ticketing system. We can start with basic dashboards showing total ticket count in given time frame, number of tickets divided by locations, exact problem types in those locations (see Figure 1). At one glance you can see the volume of tickets and compare it with previous months if you select different time settings.
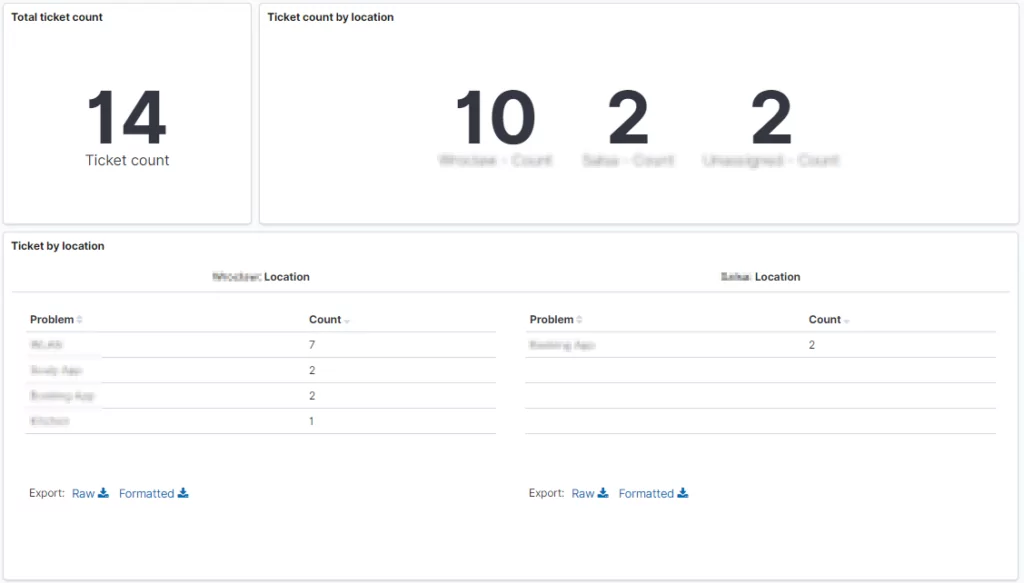
Figure 1: Overview dashboard
You can also create time plots, where number of tickets can be visualised and split into separate problems/locations or alike (see Fig. 2). You can correlate number of tickets with other actions or events (e.g., power outage or maintenance downtime).
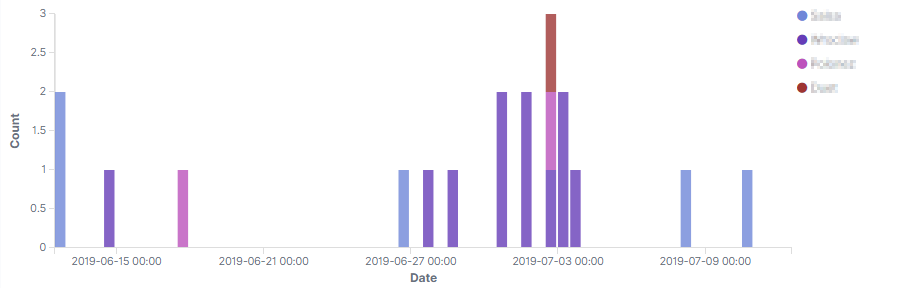
Figure 2: Number of tickets over time
Additionally, it can be seen who reports problems and what types of problems are reported by these people. In the Figure 3 you can see that employees report only one type of problem, while tenants several ones. This might lead to conclusion, that employees either do not have issues with things that tenants have (they might have better knowledge about it) or they just do not interact with those issue-prone aspects.
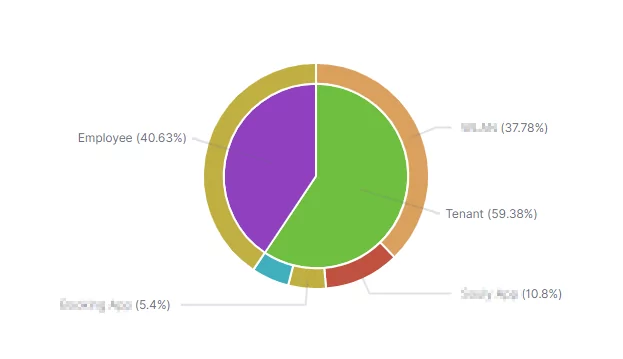
Figure 3: Problem types by reporting person
All above statistics are quite usual and perhaps some tools provide easy way of presenting summaries in such forms, but having all the data in Elastic gives you more freedom in creating custom visualisations. In the Figure 4 you can see a matrix that we called “What/Who”. It depicts how many tickets with particular problem type were assigned to specific person. Apart from analysing who is most active, you can see if there are any (wanted or unwanted) specialisations of your employees. It might be good to distribute the tickets evenly among all the members in customer support team or in some cases train someone to deal with specific type of problem.
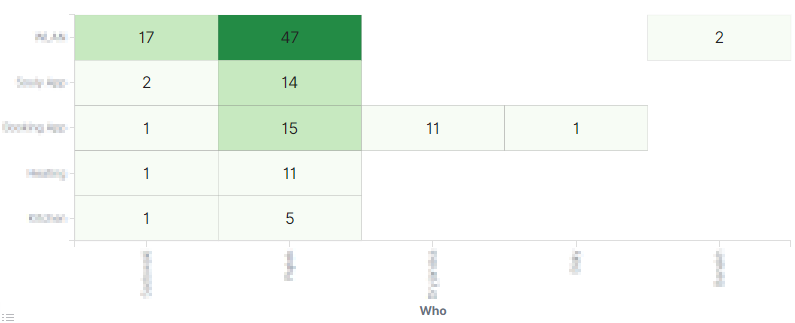
Figure 4: Problem types by resolving person
Summary
In this blog-post we showed, that Elastic Stack can be successfully used to gather and present information about the incoming requests and tickets from the customers. Integration might be dependent on the tool used for tracking tickets, but once the data is in the Elastic, you can process it up to your needs. You might be also interested in a blog post on elastic.co about integrating Zendesk with Elastic Stack (see Elastic Blog) [2].
In the next post in this series we will cover the details on how to process your incoming data and format it up to your needs. We will show how to set up processors that can drop, alter or add new fields to the data.
References
[1] Elastic Stack, https://www.elastic.co
[2] Zendesk and Elastic, Elastic Blog


Leave a Reply