In this post, we’re touching upon selected practical aspects in the field of WLAN radio parameters including:
explanation of some radio parameters and factors that the network performance is impacted by.
showing how to configure some of the radio parameters using CISCO Wireless LAN Controller
presenting simulated scenarios to show some examples of radio parameters measurements.
Radio Parameters Optimization
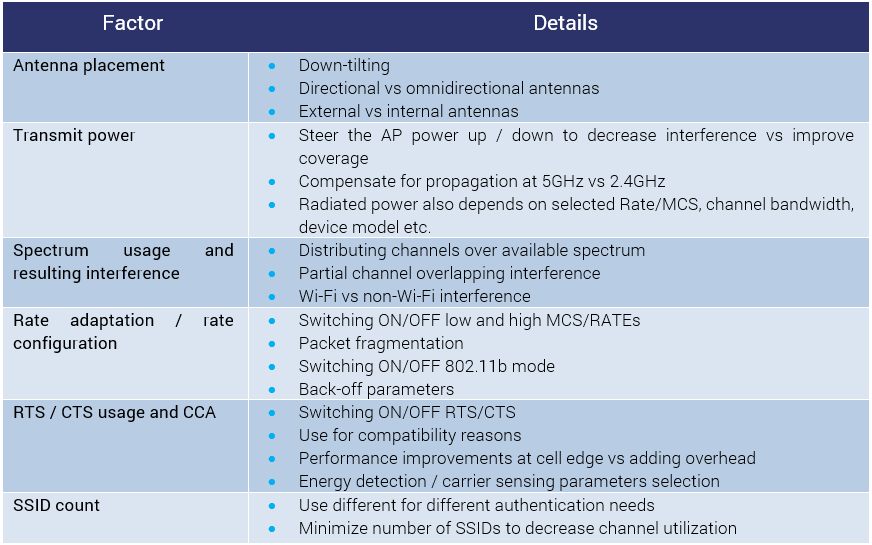
The factors that impact the performance (coverage/capacity/throughput) of the WLAN network are gathered in the table below (based on material from 7Signal).
Automatic radio resource management (RRM) algorithms/mechanisms can help in optimizing some of the above-presented WLAN parameters, for example:
Automatic selection of used channels (Dynamic channel selection) – properly distributes available spectrum to minimize co-channel interference (e.g. at 2.4GHz: channels 1, 6, 11 – loose; or 1, 5, 9, 13 – tight).
Auto adjustment of power (Transmit power control) – decrease power to avoid interference; increase power to avoid coverage holes.
Switching ON/OFF APs (Energy Management) – switch OFF some APs and increase the power of the others when traffic demand is low (e.g., night); switch ON all APs and decrease power to provide more capacity, but less interference when traffic demand is high (e.g., busy hour).
Auto-set thresholds for CCA (DCF adaptation) – setting a too low threshold (i.e., being too polite) – causes collisions and longer access waiting time; setting a too high threshold (i.e., being too aggressive) – causes high interference.
CISCO Wireless LAN Controller (WLC) Radio Parameters
Speaking of those aspects from the previous section, we here discuss some of the basic settings for CISCO WLC wireless configuration, where those can be configured.
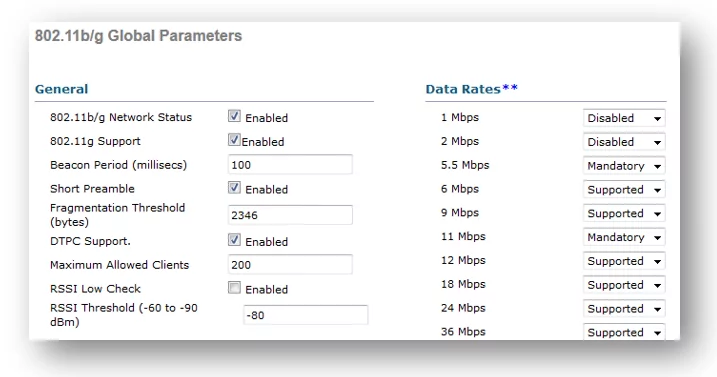
General settings
The figure below shows the tab with global settings for 2.4GHz. The individual Data-Rates (MCSs) can be separately chosen to enable/disable certain devices in the network or limit the coverage. The beacon period can be adjusted to broadcast network settings more or less often. Another checkbox allows enabling dynamic power adjustments (DTPC). Fragmentation to improve robustness can be enabled, if the Fragmentation Threshold is set to lower than 1500B. To ignore users trying to associate with an AP with low power (whose increased interference) the RSSI Low Check parameter can be enabled.
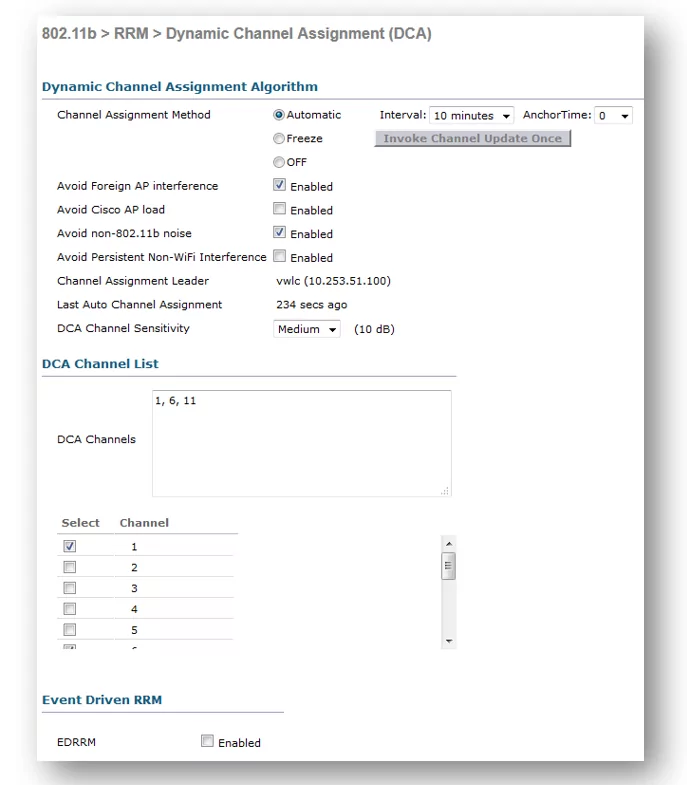
RRM settings
A more detailed configuration is provided within the dedicated RRM tabs shown below. The first one shows the settings for the assignment of the channel. You can configure the way, the controller assigns or reconfigures the channels for individual APs: e.g., if the individual AP shall select the channel to avoid Wi-Fi or non-Wi-Fi interference and what’s the interval for the update. Also, you can select how sensitive the algorithm shall be for the arriving interference and which channels shall be selected for allocation. Finally, the EDRRM checkbox enables the Dynamic update of the channel selection based on the incoming events (like an increase of interference on the given channel).
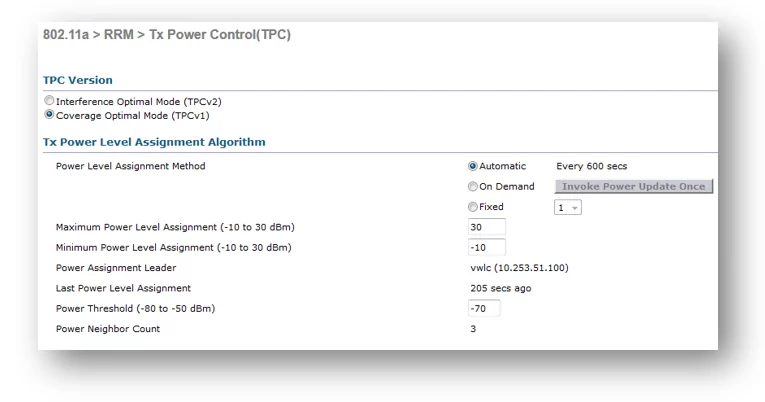
Another set of radio parameters relates to the power adaptation algorithm (see figure below). You can set the target to optimize coverage or interference and invoke measurements and update periodically or on demand. Secondly, the range for the allowed power values shall be configured. And finally, you shall set the power threshold that invokes the algorithm to increase transmit power, if the received signal from STA is below this value.
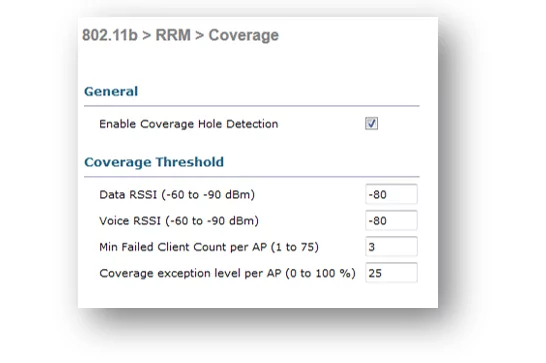
The third tab enables finding the problems with coverage – i.e., identifying weak spots (low received signal levels). If the algorithm for power control sets the Tx Power too low, the coverage holes can be experienced. The parameters in this tab define, when the notification shall be sent to the main controller dashboard, and when TPC shall take action.
Radio Parameters Measurements
One of the elements for troubleshooting wireless networks is to use a spectrum analyzer. In our discussion below, we are using Channalyzer with the WiSpy DBx module by Metageek.
Spectrum shapes
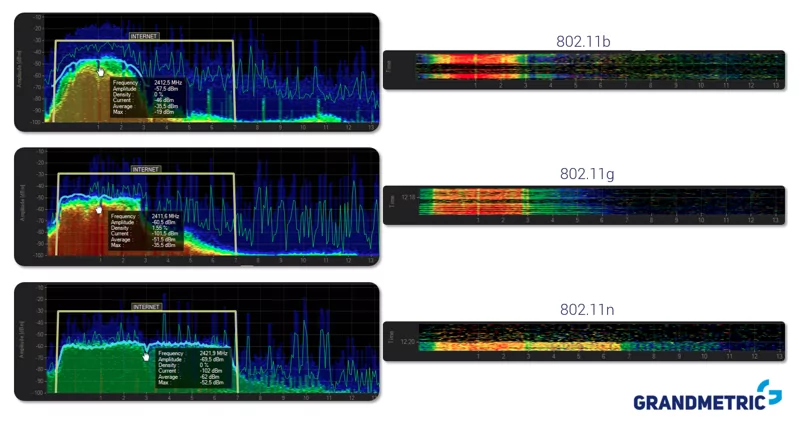
In the first figure below we are showing three different signals from three different devices using three different WLAN standards. They are connected to the same access point (AP shall be backwards compatible and support older versions of the standard). The first one – the top part of the figure – is using DSSS – based IEEE802.11b which we can distinguish by using a special spectral mask and seeing the shape of a “bell” (left side of the figure). On the right side of the figure, we show “spectrograms” (also known as “waterfall” charts), where you can see the spectrum usage over time. The central part of the figure shows 802.11g with OFDM-like shape and 20MHz channel. And the last one shows 802.11n with a 40MHz channel (HT) which is also based on OFDM – the shape is the same as for the central one, but wider.
The second figure (below) shows the comparison of the “idle” channel with the “transmission burst”. This time, we are showing a 5GHz band (802.11n) with 40MHz channel bandwidth. We can see that in the case of the “idle part” where only beacons are sent, 20MHz of primary channel is used (this is due to having primary and secondary channels in 40 and 80MHz configurations). The lower part of the figure shows the situation where the user is transmitting data, and there is much more transmitted power used and a full 40MHz bandwidth is occupied.
Site survey
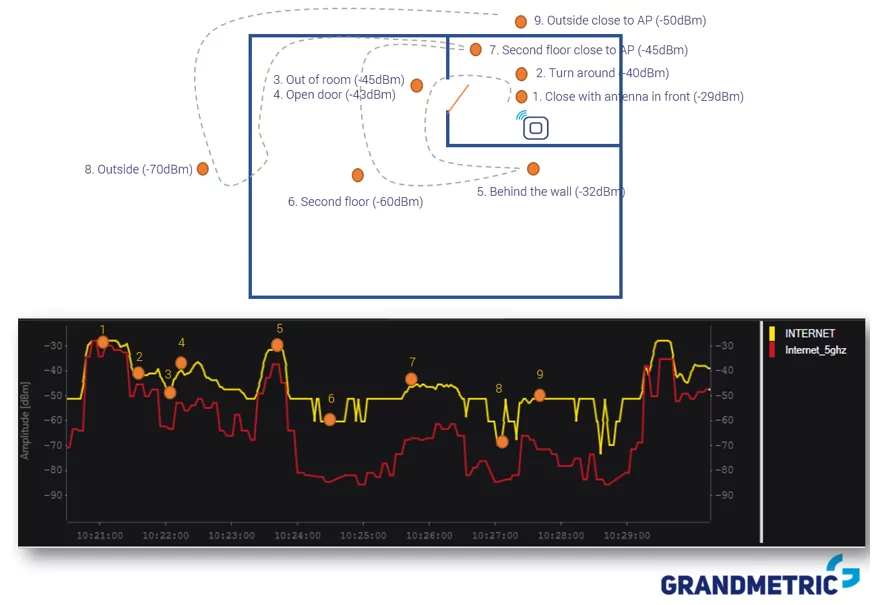
The third evaluation with the use of the analyzer is not actually showing a spectrum diagram, but the received signal power level. We have performed a simple site survey measuring the different power levels going around a house and marking certain points on the map with relevant signal power levels. As you can see, we are measuring here two different SSIDs from the same AP – one on 2.4GHz and the other one on 5GHz (note that the values on the map are showing the received signal levels at 2.4GHz).
You can immediately spot the differences between the received signal power levels on those two bands. Another point to note here is that 5GHz does not have just a constant difference from the 2.4GHz, but also encounters different attenuation when looking at different obstacles. On the other hand, when being close to the AP, the signal levels are very similar, as the receiver is getting saturated. Also, important to mention is that apart from wall and floor attenuations, there is a significant difference in received signal power (around 10dB), by just turning around from the AP in the same position.
A Step Back
Configuring power levels, spectrum and channel parameters to assure coverage and data rates for the users is only a water drop in a sea of optimization, troubleshooting and configuration of the wireless networks, but gives a feeling of what kind of radio parameters and measurements we need to take into account when operating a WLAN system. Planning the number of APs and their location, configuring service types, QoS levels, higher level RRM algorithms, and WLAN MAC settings is another big topic that needs to be taken into consideration when you want to make sure that a Wi-Fi network satisfies the expected performance.
Marcin Dryjanski received his Ph.D. in telecommunications from the Poznan University of Technology in September 2019. During the past 15 years, Marcin has served as R&D Engineer, Lead Researcher, R&D Consultant, Technical Trainer, Technical Leader and Board Member. He has been providing expert-level courses in the area of 5G/LTE/LTE-Advanced for leading mobile operators and vendors. In addition to that, Marcin was a work-package leader in EU-funded research projects aiming at radio interface design for 5G including FP-7 5GNOW and FP-7 SOLDER. He co-authored a number of research papers targeting 5G radio interface design and a book "From LTE to LTE-Advanced Pro and 5G" published by Artech House. Marcin is co-founder of Grandmetric and co-founder and CEO at Rimedo Labs, currently focusing on Open RAN systems.


Leave a Reply